How to trade with RSI (Relative Strength index)
RSI is a technical indicator to decide on overbought and overbought.
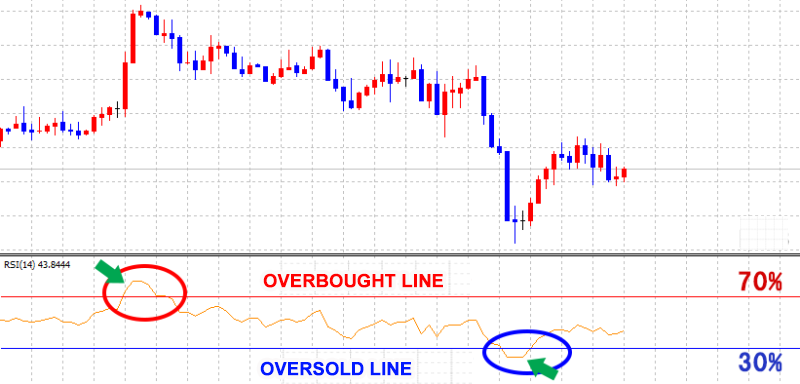
The RSI is shown on the chart the chart below in Figure 1.3. Limits will vary from 0% to 100%, but if the limit exceeds 70%, it becomes the threshold for overbought and if the limit goes below 30%, it becomes the threshold for oversold.
RSI has a disadvantage when the trend is strong, such as strong price surge or drop.
When combined with other technical indicators, RSI should be used appropriately for each case.
Sample trading using RSI
RSI reverses fundamentally.
RSI predicts “Sell" if overbought above 70% and “Buy" oversold below 30%.
In addition, when the RSI falls below the highs in the previous trading session, it can be used as a “sell" trend, but of course the probability will be higher if combined with other technical indicators.