How to display and trade using MACD on MT4
MACD stands for “Moving Average Convergence and Divergence" – a method for analyzing the timing of a buy or sell by displaying two exponential moving averages.
This article will show how to display and trade the MACD on MT4.
How to display MACD on MT4
MACD is a standard indicator available when downloading MT4.
Can display by dragging and dropping the MACD onto the chart you want to apply. from “momentum" → “MACD".
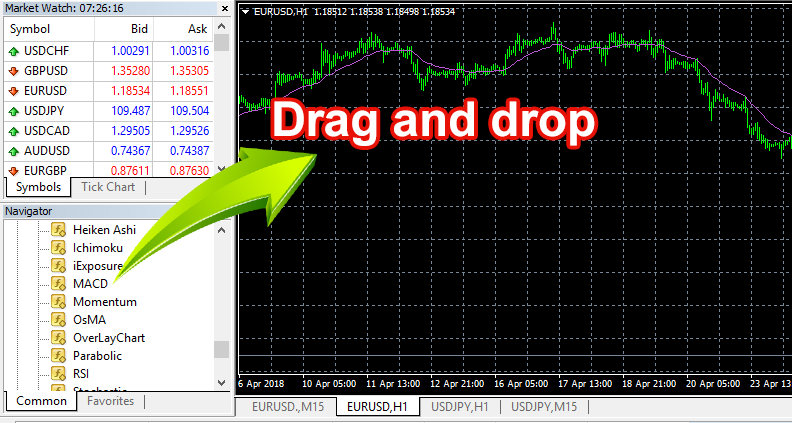

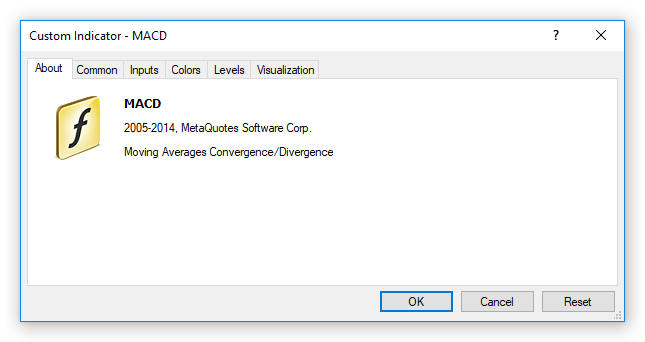
The MACD setup screen will be displayed, you can still use in basic installation mode without reinstallation.
Click on the “OK" button, the MACD will be applied to the chart.
How to view and apply MACD
MACD has two ways of analyzing.
- Analysis to predict market price trends using the zero line as benchmark.
- Analysis to predict a sell or buy signal at the time the MACD intersects the signal line.
In any case, trading prediction will vary based on the time frame, in which short time frames of 1 minute or 5 minutes of trading are easy to deceive.
Therefore, when trading in a 15-minute time frame, if you combine the 1-hour time frame, it is easier to predict the trade.
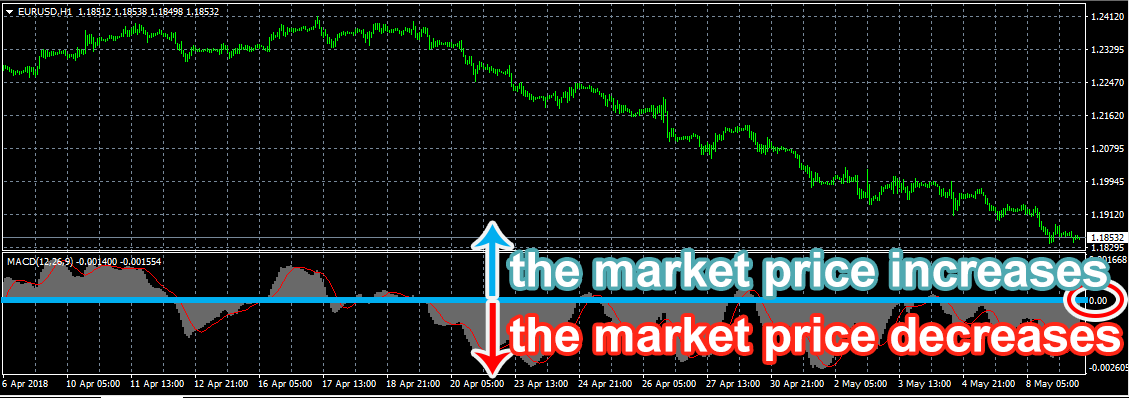
Analysis to predict market price trends using the zero line as benchmark
The MACD is displayed at the center of line 0.
- When the MACD is above the 0 line, the market price increases.
- When the MACD is below the 0 line, the market price decreases.
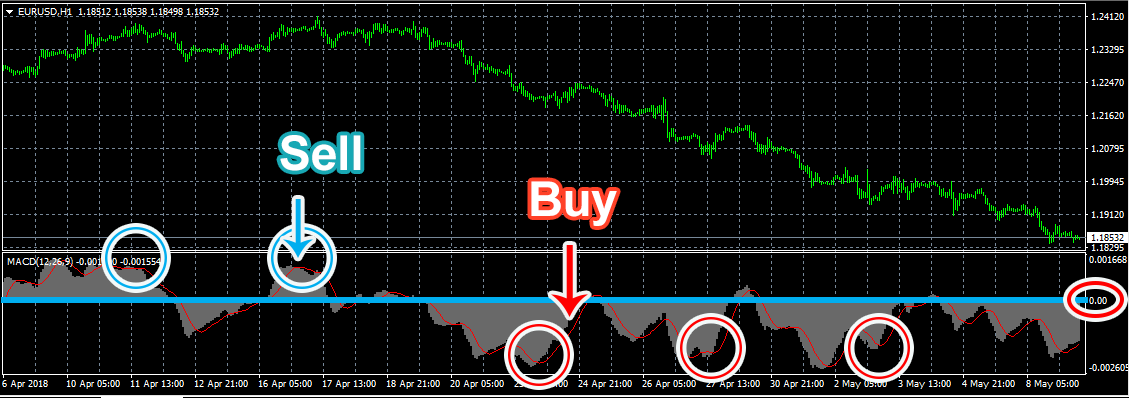
Trading time
Use 0 as benchmark, you can predict the “Buy" position at a time when the price line moves from negative to positive and “sell" at a time when the price line moves from positive to negative.
Analysis for selling and buying when MACD intersects with the signal line
The line chart as the signal line at the Column Chart is the MACD, which was displayed at the MT4 sub window.
You can predict a trade when the MACD crosses the signal line.
- When the MACD cuts the signal line upwards , MACD becomes Golden Cross, a “Buy" indicator.
- When the MACD cuts the signal line downwards , MACD becomes Death Cross, a “Sell" indicator.
If coupled with an intersection between MACD and signal, the market trend for line 0 when trading on a compound risk basis becomes low.
The MACD is a momentum indicator to predict “overbought" and “overbought" conditions, so the MACD is often used together with other indicators such as envelope or moving averages.