How to plot Relative Strength index (RSI) on MT4
Here is how to plot Relative Strength index (RSI) on the MT4 application for smartphones. Plotting RSI is very simple with 3 steps.
RSI is an indicator used to identify the overbought and oversold conditions.
Contents
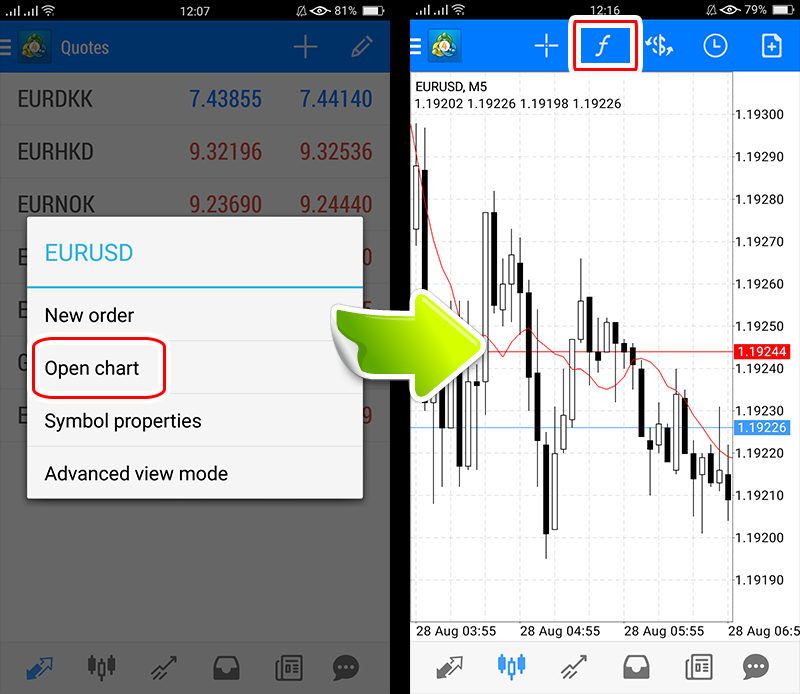
Step 1: Display the preferred chart
Click “Open chart" on the preferred currency pair of MT4 trading app.
Then, click the “f" symbol on the chart screen.

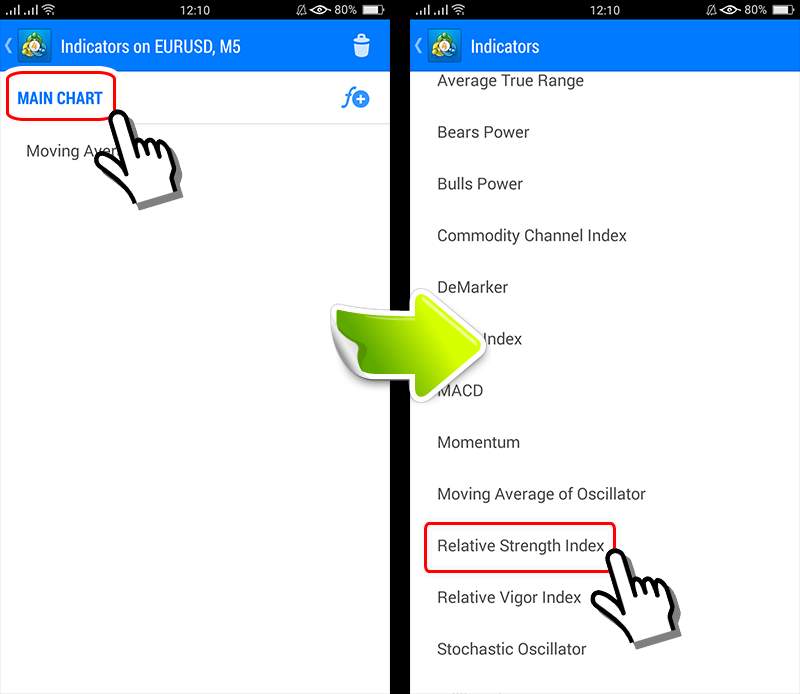
Step 2: Insert Relative Strength index
Tap on “Main chart" then select"Relative Strength index". (it will be shown at the bottom when moving screen)
Step 3: Insert Relative Strength index
The setting screen will appear, especially RSI could still be used without being set up When you click “Done", RSI will be shown on the second level of the chart.
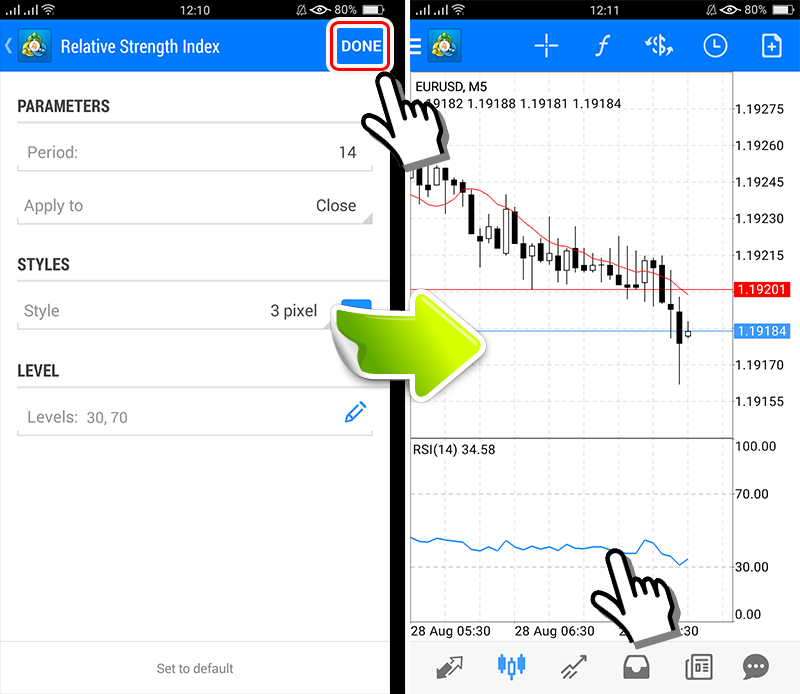
Identify a “sell" opportunity if RSI is above 70% and “Buy"if RSI is below 30%.