How to trade with Trend line
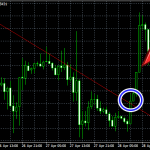
What is Trend line?
If the market price increases, it is a straight line that connects low prices with low prices and ...
How to use Equidistant Channel on MT4
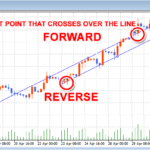
What is Equidistant Channel?
Equidistant Channel is an indicator that automatically adds a trend line parallel to the ...
How to trade using Bollinger Bands
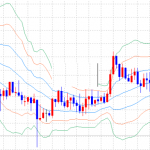
What are Bollinger Bands?
Bollinger Bands are technical indicators designed to complement statistical techniques on th ...
How to trade using Ichimoku Kinko Hyo
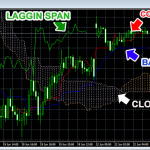
What is Ichimoku Kinko Hyo ?
How to viewIchimoku Kinko Hyo
How to viewIchimoku Kinko Hyo
Ichimoku Kinko Hyo is composed of four main elements the ...
How to trade with RSI (Relative Strength index)
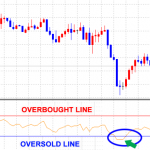
What is RSI (Relative Strength Index)?
RSI is a technical indicator to decide on overbought and overbought.
The ...