How to trade using Bollinger Bands
Bollinger Bands are technical indicators designed to complement statistical techniques on the moving average.
Statistical techniques are methods that use standard deviation and price change rates to visualize the range of price fluctuations with an assumed stable probability.
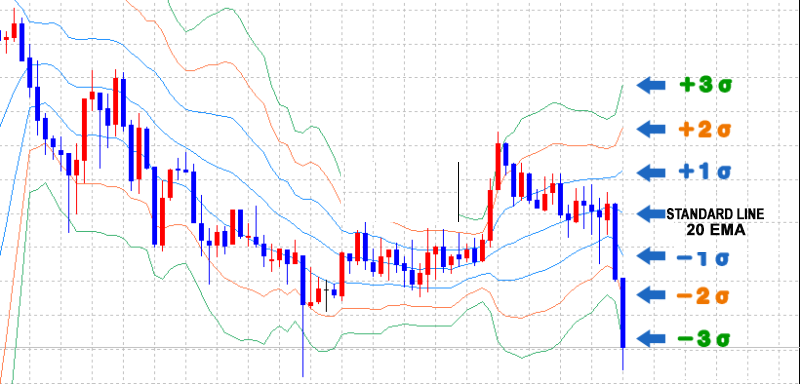
The Bollinger Bands predict trading by the direction or position of the current price by drawing a line that is suitable for conditions such as ± 1σ (Standard deviation 1), ± 2σ (Secondary deviation), ± 3σ ( Standard deviation # 3) in the direction from the center of focus to the outside.
Trading points using Bollinger Bands
For example, if the current price is outside the “-2σ" or “2σ" range of the Bollinger Bands, you can predict the value within each range of ± 2σ because the probability is only 4.5%.
Sample trading using Bollinger Bands
Bollinger Bands are basically reversing trading.
- Sample reversing trading
- If you touch the + 3σ line, the “Placing Order" will be expected when the value is within + 2σ of high probability. Determine profit by baseline or 2σ.
- Sample Stop Loss trading
- “Place buy order"If you touch the line + 3σ. After that, we will place a stop loss order because the -3σ line breaks and the price has fallen.
Bollinger Bands can be traded as above.