How to trade with Trend line
What is Trend line?
If the market price increases, it is a straight line that connects low prices with low prices and vice versa, if the market price falls, it is a straight line that connects high prices with high prices.
You can display the market price trend by drawing a trend line.
- Trend line goes up = Uptrend
- Trend line goes down = Downtrend
If the trend line goes up, it can be predicted that the price trend is rising, if the trend line goes down, it can be predicted that the price trend is falling.
How to predict a trading using trend line
Buy at low volatility of an uptrend
At the uptrend, when price hits the trend line, it tends to swing more.
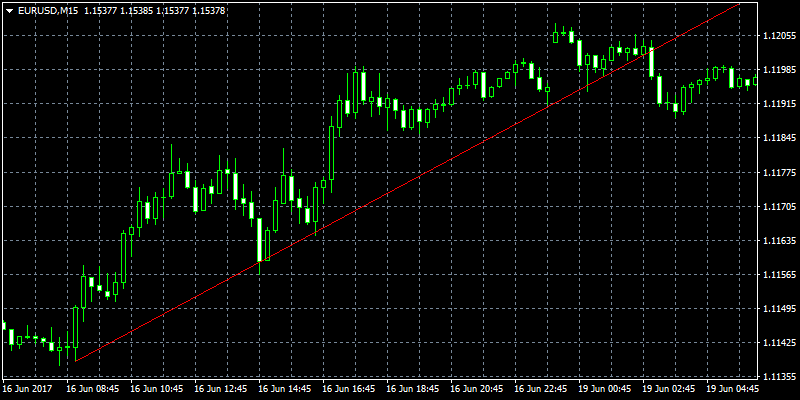
Graph displaying an uptrend
In the example above, price will fluctuate in the proximity where price has reached the trend line and you will easily make a profit by placing a"buy order" at high volatility.
Moreover, “buying at increasing volatility" is placing a buy order by identifying where prices temporarily go down in a uptrend.
Sell at a swing high in an downtrend
In a downtrend, price tends to swing low when it hits the trend line.
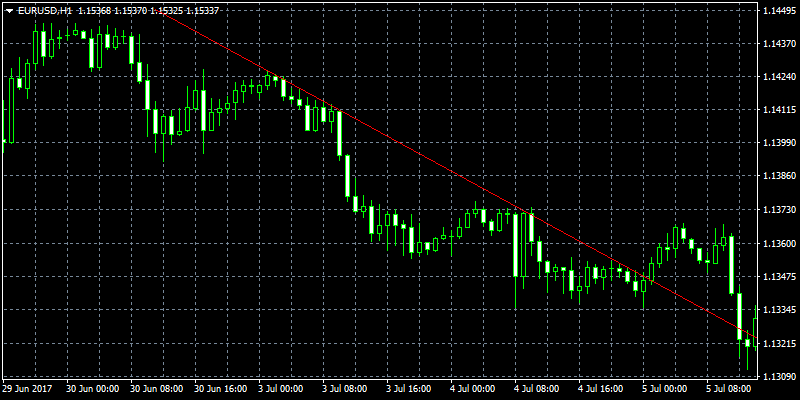
Graph displaying downtrend
In contrast to the uptrend, price will fall in the proximity where price reaches the trend line and you will easily make profit by placing a “sell order at swing high price".
Moreover, “selling at increasing volatility" is placing a sell order by identifying where prices temporarily go up in a downtrend.
When to close an order
Profit determination (closing an order) will be identified by drawing channel line based on “selling at decreasing volatility" and “selling at increasing volatility" using trend line.
The channel line is an automatic drawing indicator that adds a trend line parallel to the trend line.
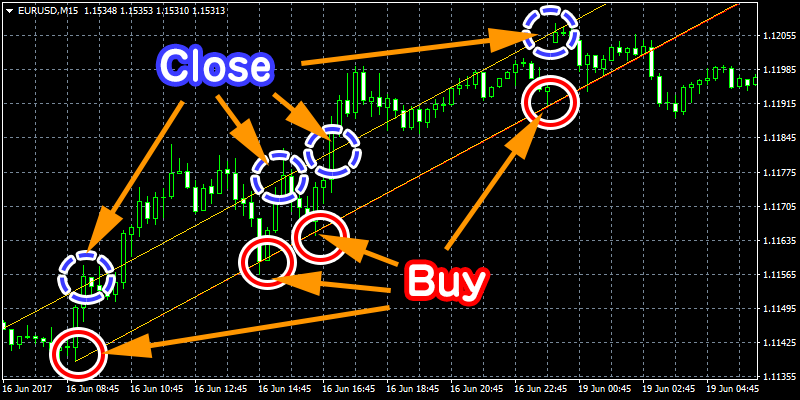
Sample for identifying when to close an order using channel line
In the chart above, the “buy” order is placed at the red circled area and closed (profit taking) at the blue circled area.
Trade when trend reverses
When the price completely rises above the trend line or falls below the trend line, the trend tends to reverse.
When trend tends to reverse, profits are rising and you will easily make a profit if you trade outside of the trend line.
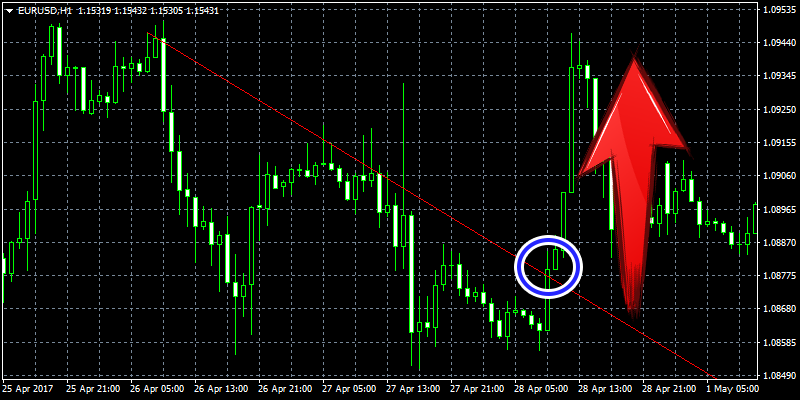
Sample graph of break point
In the circled blue area in the example above chart, price is rising above the trend line. Prices above this line is called a break point. (Price rising above is call break out, price falling lower is called break down).
You can easily make a profit by placing a “Buy" order at the break point of the chart example above.
However, please note that there is a “trick" to let us know that the price has escaped the trend line.