How to display RSI on MT4 (Relative Strength Index)
What is RSI (Relative Strength Index)?
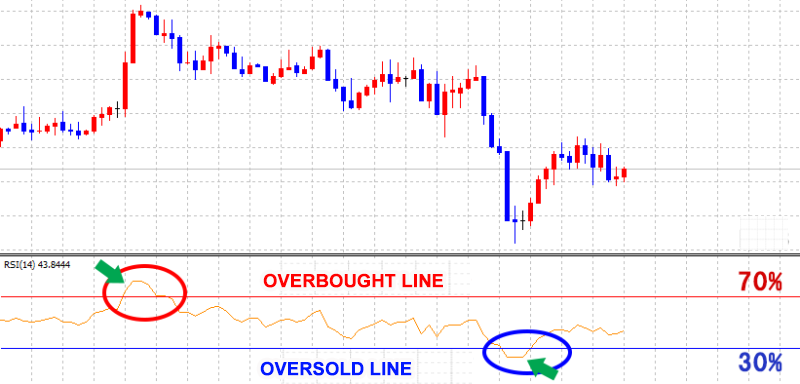
RSI is a technical indicator to decide on overbought and overbought position.
The value oscillates from 0% to 100%, but if the price exceeds 70%, it becomes the threshold for overbought and if the prices falls below 30%, it becomes the threshold for oversold.
How to display RSI
It is very simple to display RSI.
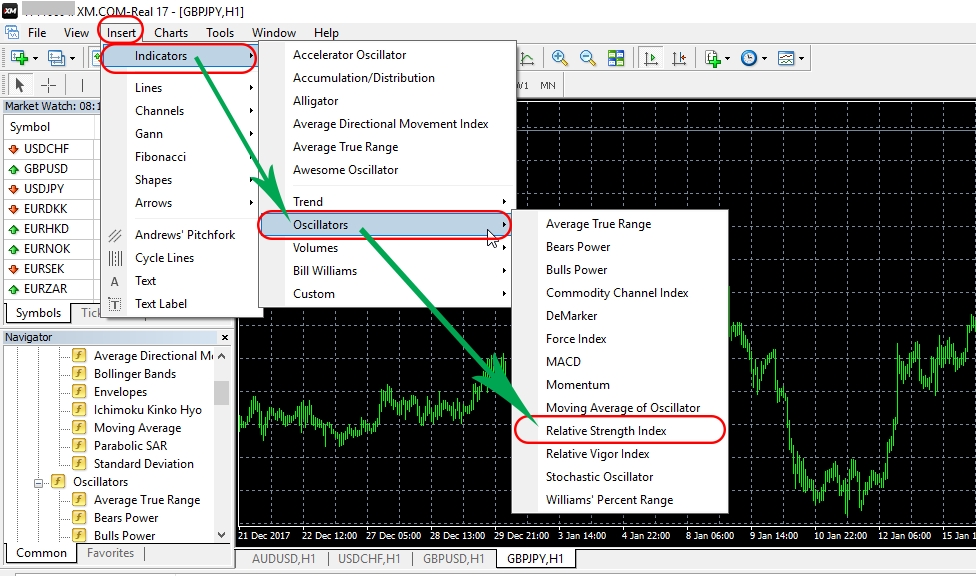
Can be displayed within 4 steps“Insert” → “Indicators” → “Oscillators” → “Relative Strength Index”.

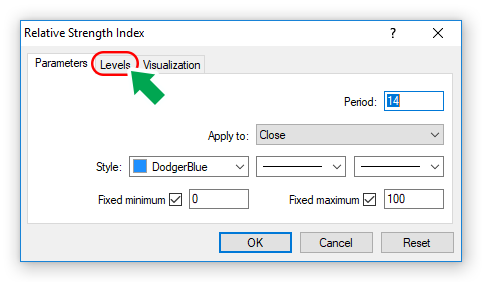
After the value settingv screen is shown, click on “Level" at the top of the screen.
Here, you can draw a line on the data line you set.
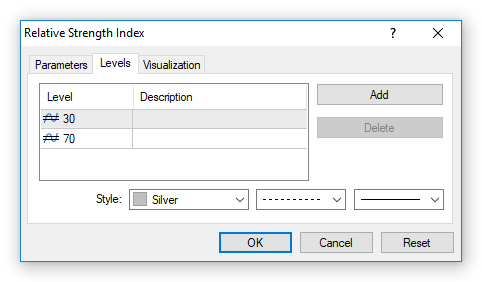
Following simple steps above, you can now display RSI.