How to trade using the exponential moving average (EMA)
EMA (Exponential Moving Average) is a moving average developed to counter the lagging weakness of the SMA (Simple Moving Average) in reaction to price changes, averaged out and plotted on the price chart over a specified time period.
EMA is calculated by giving more weight to most recent data
The chart below is a graph showing the moving average. The blue line is 10EMA, the brown line is 20EMA.
When trading in a short time (5 minute time frame), the EMA is characterized by a high probability of resistance at low values, such as the EMA10 or EMA20, respectively.
In addition, 25EMA, 75EMA, 200EMA are commonly displayed in Japanese trading houses.
The larger the value, the more likely it is to resist.
25EMA < 75EMA < 200EMA
Example about the cycle of EMA
The cycle of the moving average is not specified, but in addition to 25, 75, 200, the following cycles are generally used.
- Short-term moving average: 5, 8, 13, ..
- Medium-term moving averages: 21, 25.75, ..
- Long-term moving average: 100, 200, ..
For example, if the exponential moving average is “5EMA" then plot the constant multiplied by the average exchange rate of the five candlesticks in the past. In case of day time frame, the average exchange rate will be of 5 days, in case of 15 minute time frame, the average exchange rate will be of 1 hour 15 minutes (15 minutes x 5 bars candles).
Predict trading using the moving average
Trading forecast based on price change with moving average
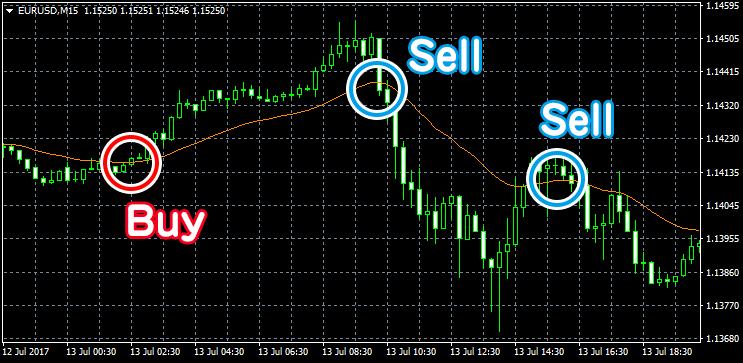
The example shows 25EMA on the 5 minute time frame chart
- Price touches the moving average above the price : Sell (reverse)
- Price touches the moving average below the price : Buy (Reverse)
- Price above the moving average: Buy (Same direction)
- Price below the moving average: Sell (Same direction)
In the example above you can predict the trading by placing a “buy"order at a price above the EMA (red circle) and placing the “sell" order as prices go down below the EMA (the next blue circle).
There will also be a slight deviation, but prices will intersect in with the EMA and fluctuate at the last green circled area. You can place a “Sell" order at the decreasing fluctuation.
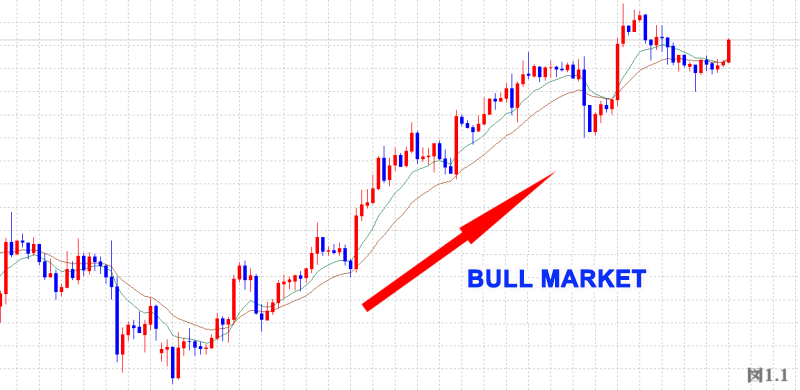
Predict trading based on the direction of the market prices
- Bullish Moving average: Market Prices increases (Placing Buying Order)
- Bearish Moving Average : Market Prices decrease (Placing Selling Order)
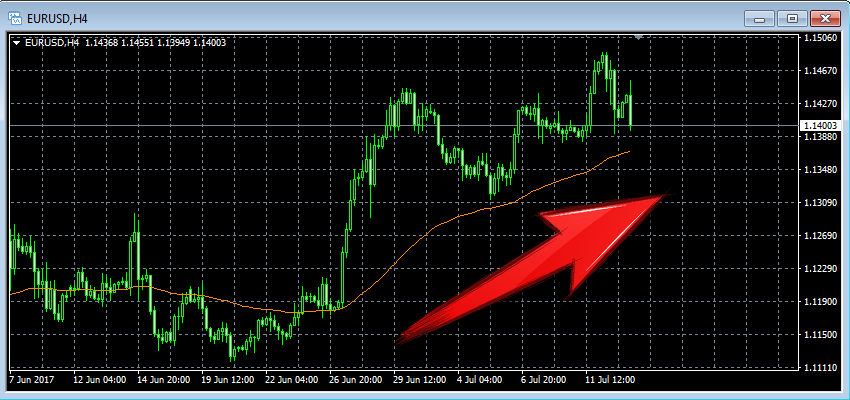
The example shows the 75EMA on EUR / USD chart with 4 hour time frame.
EMA on the chart above is moving up from mid point. If the moving average continues to rise, the market price increases and you can easily make a profit by placing buy orders.
On the contrary, if the moving average is going down continuously, the market price goes down, so you can make a profit if you place a sell order.
Predict selling or buying by the intersection of the moving average
- Golden cross: buy signal
- Dead cross: sell signal
Golden cross means when the short-term moving average exceeds the mid-term moving average.
Dead cross means when the short-term moving average falls below the mid-term moving average.
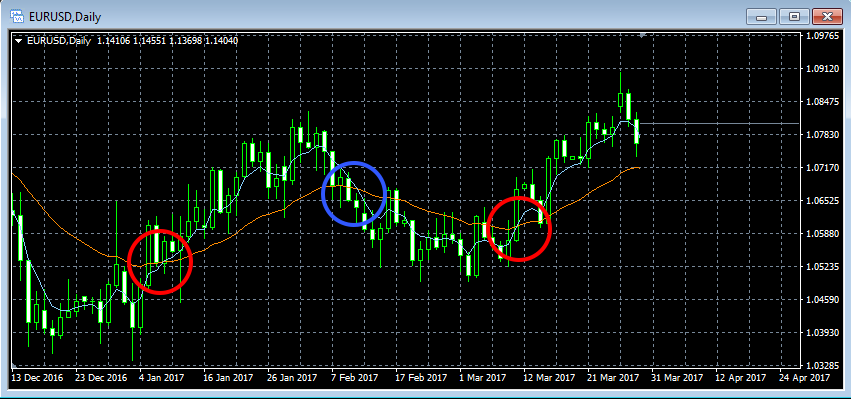
For example show 10EMA and 25EMA on USA / JPY chart time frame of 1 day
The red circle in the example above is a golden cross, so you can make a profit when placing buy orders.
The blue circle in the example above is a dead cross, so you can make a profit when placing sell orders.