How to make money using Fibonacci PIVOT!
It is the series of integer that is named after the Italian mathematician Leonardo Fibonacci.
It may look like a mystery but there are many evidences of Fibonacci numbers recognized in the nature such as plant petals, spirals in sunflower or the spiral patterns of shells.
Most of investors made their decisions based on either exchange rate volatility or rules (laws) of nature (economics, market) as well as temporary trends (fashionable trends).
Such a way of predicting exchange rate (market) volatility is called Fibonacci Retracement.
What is Fibonacci PIVOT?
Fibonacii PIVOT is an original indicator that has been illustrated in the book “Mr. Shirofukurou” by a famous Japanese author about his art of making money with FX Metatrader.
Applying the Fibonacci agonistic into PIVOT calculation can help improve the accuracy significantly.
Illustration/ Example of a Fibonacci PIVOT trade
In the figure below, the discreet red bar shows the status of displaying Fibonacci PIVOT
Fibonacci PIVOT is displayed as the green/blue line in the centre.
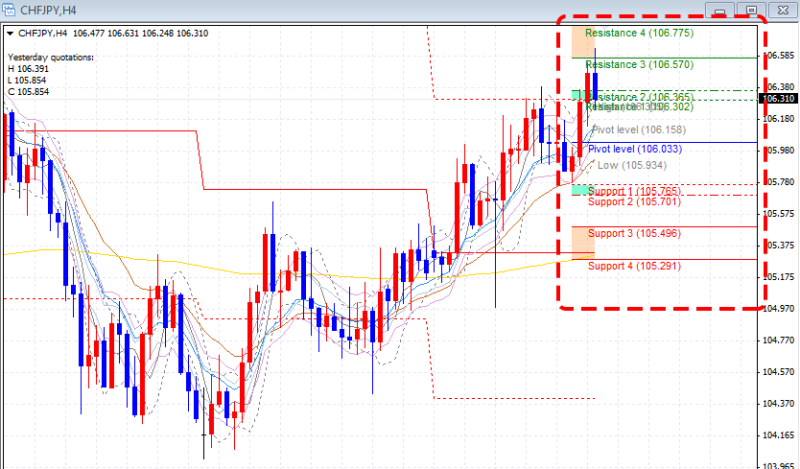
PIVOT value is in the middle with 8 auto generated line, above are resistance line 1,2,3,4; below are support line 1,2,3,4
Besides, according to Robert Krausz method, Resistance zone 1 is the area between resistance line 1 and 2 and support zone 1 is the area between support line 1 and 2 in green.
This is based on the focus on the whole zone instead of the Fibonacci PIVOT line, this zone includes Resistance and Support.
Display Resistance zone 2 as the area between resistance line 3 and 4 and support zone 2 as the area between support line 3 and 4 in orange.
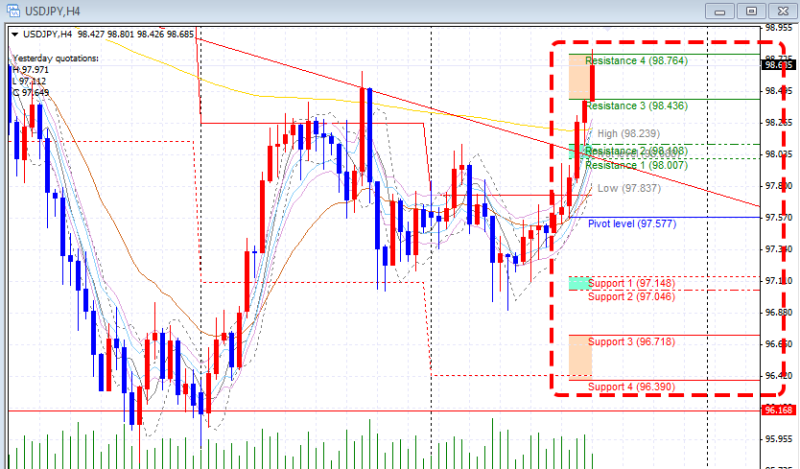
As seen in the figure above, there is a high probability that price will bounce back (or drop back) unless breaking through the Fibonacci PIVOT.
Illustrative/Example Trading strategy
- Buying case
- If price drops to S1 then hunt for cheap buy.
- If price continues to drop to S2 then either cut loss or increase buying amount if you are holding call options.
- A profit can be made if price increases to R1.
- If price drops to S3 then cut loss or sell the call options.
- Selling case
- If price increases to R1 then sell on rally.
- If price increases to R2, cut loss or either increase selling if you are holding other put options.
- A profit can be made if price then drops to S1.
- If price increases to R3 then cut loss or sell the put options.
The above strategy is just for reference, trading in your own strategy is also very important.
Since Fibonacci PIVOT is based on probability theory, there are many cases that it turns out to be wrong
However, if the amount of trade increases, the higher probability will turn to favor.