How to make money using EMA (exponential moving average) XM Group
A simple moving average (SMA) is plotted on a price chart as a line that represents the average of prices over a specified period of time.
An exponential moving average(EMA) is the moving average devised to solve the problem of the simple moving average that lags behind the price movements.
It places more weight on the most recent prices and applies a smoothing multiplier for its past data calculation.
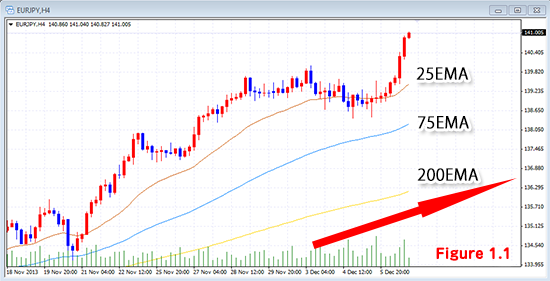
Figure 1.1 shows the moving average line. The brown line represents 25EMA, and the Blue line represents 75EMA.
The feature of each candlestick (bar price) is that there is high probability of rebound in 25EMA and 75EMA.
Moving average is employed to determine whether the trend of the market (direction) is downtrend or flat.
Based on these features, you can judge whether to buy or not and anticipate “profit-taking" position when EMA (exponential moving average) trends upward.
In general, there are many cases where multiple EMAs, such as 25EMA, 75EMA and 200EMA, are displayed.