How to display Bollinger Bands
Bollinger Bands are technical indicators designed to complement statistical techniques on the moving average.
Statistical techniques are methods that use standard deviation and price change rates to visualize the range of price fluctuations with an assumed stable probability.
How to display Bollinger Bands
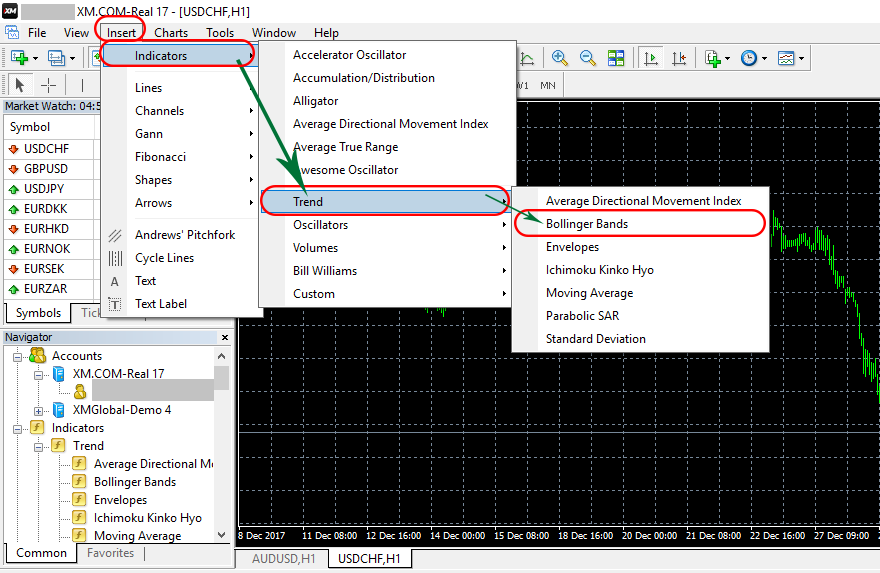
It is very simple to display Bollinger Bands.
Can be displayed in the following four steps “Add" → “Support Tools" → “Trends" → “Bollinger Bands".

After the deviation screen is displayed, enter the value of σ that you want to display in “Deviation".
If you want to show the deviation of 1σ, enter “1", if it is 2σ, enter “2". Usually it could show up to 3σ.
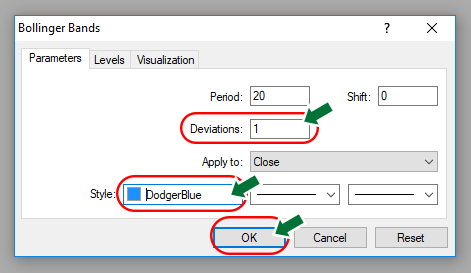
Alternatively, you can also select a line type or change the color in the style box.
Finally, after setup, click “OK".
With this simple setup, you can display Bollinger Bands.
Bollinger Bands not only displays 1σ deviation but it can also display many σ.