How to make money using RSI
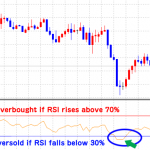
RSI (Relative strength index)
RSI is a technical indicator used to identify the overbought and oversold conditions. RS ...
How to make money using Bollinger Bands

Bollinger Bands
Bollinger bands is a technical analysis devised after adding statistical technique to a moving average ...
How to make money using EMA (exponential moving average) XM Group
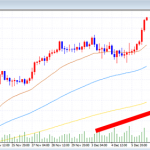
EMA (Exponential Moving Average)
A simple moving average (SMA) is plotted on a price chart as a line that represents t ...
How to open a free DEMO Account. Forex trading with 1000:1 leverage at XM Group
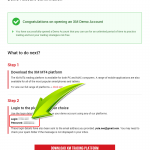
To practice free trading, you can open a demo account with XM Group.
By opening a demo account with XM Group, y ...