How to plot moving average EMA on MT4
EMA (Exponential Moving Average) is a moving average developed to counter the lagging weakness of the SMA (Simple Moving Average) in reaction to price changes. SMA is averaged out and plotted on the price chart over a specified time period. EMA is calculated by giving more weight to most recent data
How to plot EMA (Exponential moving average)
It is very simple to plot EMA
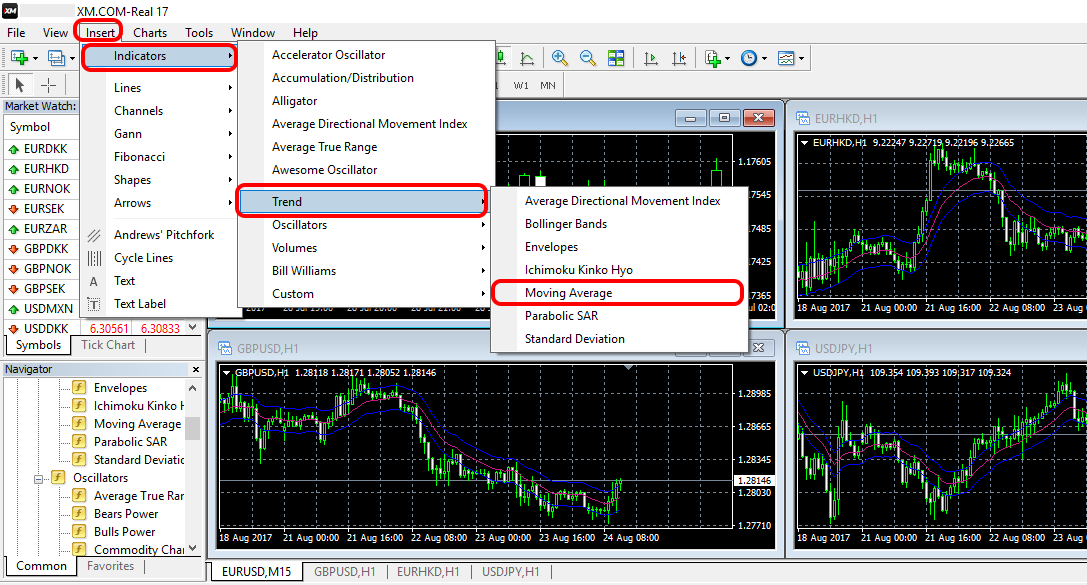
EMA can be plotted within 4 steps“Insert” → “Indicators” → “Trend” → “Moving Average”.

When the period setting window appears, select preferred period
Because you want to show EMA, in the “MA method” section select “Exponential”.
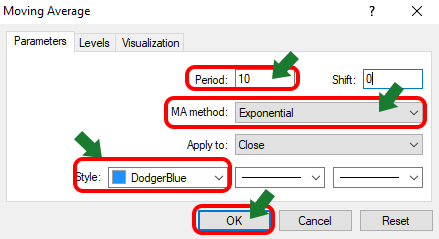
Commonly used periods are 14EMA、25EMA、75EMA、200EMA but you can adjust as you want
For short-term trading such as Scalping, you should consider shorter periods such as 10EMA, 20EMA.
Alternatively, you can also choose a line type or color change in the grid.
Finally, after completing the setting click “OK”.
EMA could be plotted within simple steps above.
EMA can be plotted by one line or multiple lines. By reiterating the above steps, you can plot multiple EMA lines on the same chart